My research question has not changed too much since my proposal and I was able to identify some patterns. I answered the question of what type of item do I buy the most on Amazon (Books) and how much I’ve spent in a year on Amazon (never more than $700, but usually much less than that). I was also interested in identifying whether I primarily use Amazon to shop for myself or as a place to purchase gifts for others. I have done a fair amount of both kinds of shopping throughout the years, but I also identified an outlier: purchasing for work. I’m wondering if I accidentally used my personal Amazon account, instead of the Amazon account I had for work in 2011, to purchase materials for the library I was working at. I can’t remember the details regarding this particular circumstance, but I know now that I can look back at some other accounting details (i.e. bank statements) to see if I was reimbursed for the items in question.
This visualization is really only relevant to me, in my opinion. Nevertheless, I do foresee this kind of visualization being relevant to others who may want to analyze their own Amazon shopping habits.
My data is a visualization of my Amazon buying habits since 2004. I began by creating the data myself as I was copying and pasting the data from the My Orders area of my account into a google sheets file then exported to an Excel file capturing: Purchase Date, Item Name, Item Cost, City State and zip of delivery, vendor (mostly Amazon, but sometimes a 3rd party), then I added my categories of Department and whether it was a gift or for me. These last two data points gave me the most difficulty as I was having to make judgements on my own which were not always consistent and then I had to go back and clean it up. Also, I wanted to include a map in my visualization so I had to use latlong.net to determine geographic coordinates (by inserting zip code I was able to get this info). My visualization became fourfold: A stacked bar chart indicating whether the items I purchased in a given year were for me or for someone else, the number of items purchased within a department category (determined by me) throughout my purchase history (I’ve bought mostly books!), the annual amount of money I’ve spent on Amazon, and finally where the items were shipped to (by placing points on a map, I was able to represent this).
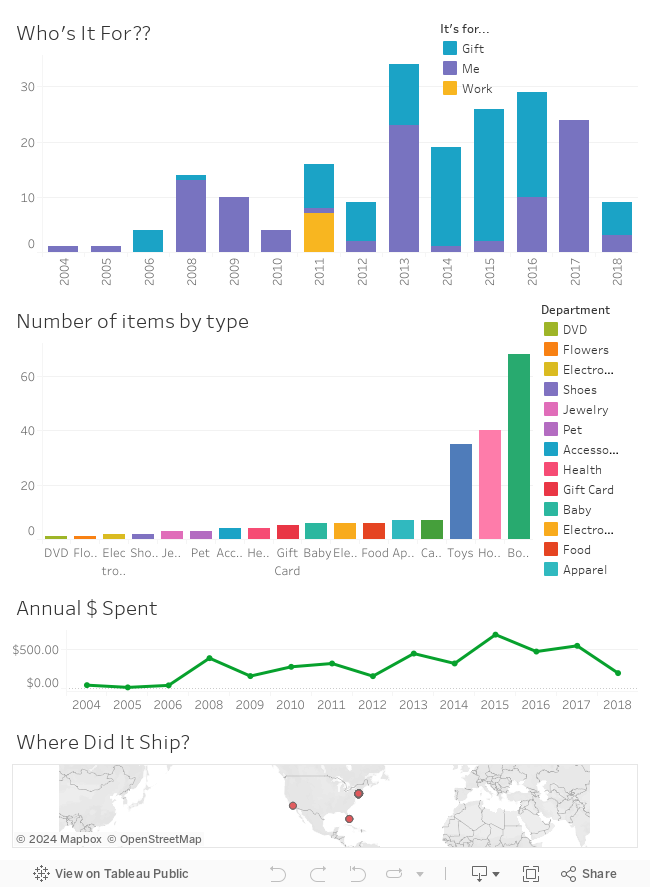
Some of the data design decisions I had to make were what kind of charts I wanted to use to visually represent my data. For this project, I was able to use a variety of chart types: stacked bar chart, bar chart, line graph, and map. I was able to achieve each of the visualizations I proposed in my sketch! The stacked bar chart offers a good representation of the proportion of items that were purchased for myself or someone else in a given year. I used the same palate of colors for this visualization as I did for the standard bar chart. The bar chart is very colorful and includes a lot of categories, so it’s not my favorite (I probably could have combined categories to make it less busy) of this week’s visualizations, but I do think it does a good job at demonstrating the variety of items for purchase on Amazon. I must admit that the color scheme is inspired by Pride (I was in Los Angeles this weekend and the Pride Parade was a huge event taking place in West Hollywood where I spent a fair amount of time). I am not sure that this color decision totally contributes to the success of this project, but it was how I was feeling this weekend as I worked on my project. The line graph is green because it demonstrates a monetary data set. Lastly, I had bigger hopes for the map visualization, but I wasn’t entirely able to get it to do exactly what I wanted. Thanks to a YouTube video, I was able to figure out that Longitude belonged in the columns, while Latitude belonged in the rows field. I probably should have been able to figure this out on my own, but the software is a bit overwhelming, so I’ve had to seek help for some obvious answers. I also spent a fair amount of time removing redundant headings and changing the visible fields in the tool tip. I put all four visualizations into the Dashboard, but I am not entirely delighted with the way they all came together. I wanted there to be four quadrants of visualizations, but I was only able to stack them one on top of the other. The line chart and map are a bit congested looking.
I am interested in exploring the map visualization more in addition to developing more proficiency with the Dashboard functions. If I wanted to take this project further, I could explore other online buying habits or do more analysis of this data set that would provide some insight into my life. For example, there was a spike in purchasing in 2016. I moved that year, so I was buying a lot of things for my new apartment. Also, in 2013, I went to Burning Man, so I bought a lot of camping gear that year. From a cursory investigation, I am able to identify big life events through my shopping habits. It would be interesting to pursue this further.